Running my DSMR parser backwards into a virtual smart meter
A while back I wrote about how Erlang's parser tools saved my DSMR library: the story of binning a pile of regex and letting leex and yecc read the telegrams that Dutch and Belgian smart meters spit out every second. Messy text in, tidy Elixir structs out. I was pretty happy with it.
Then I got a little obsessed with running it the other way.
It started, as these things do, while I was writing tests. Every time I wanted to check the parser handled some edge case, I'd go digging for a captured telegram to paste in. And every time, the same nagging thought: I already have a complete description of what a telegram is: the grammar, the field types, the structs. Why am I copy-pasting strings around like it's 2009? Surely I could hand the library a struct and get a byte-perfect telegram back out.
That nagging thought turned into p1meter.dev: a virtual smart meter you can talk to over plain TCP, or just leave open in a tab and watch tick over.
The itch: a parser with nothing to parse
Here's the slightly absurd problem with building a smart meter library: to actually test it, you need a smart meter. Mine lives in a cupboard under the stairs, behind a P1 cable I have to physically go and plug into a laptop. Romantic, it is not.
Other people hit the same problem. Anyone building a Home Assistant integration, a P1 reader, or a parser like mine runs into the same wall: the only realistic test data is locked inside a box bolted to the wall.
A meter only ever emits telegrams. It never reads them, so my library only ever spoke half the protocol. Teach it the other half, struct to string, and suddenly I could generate as much realistic test data as I liked. No cupboard required.
First attempt: a Livebook
The first version wasn't a website. It wasn't really a project at all, just a Livebook. A Mix.install with dsmr and kino, a little GenServer coughing out a telegram every second over a TCP socket, and a VegaLite chart watching the usage curve climb.
And it worked! Which was sort of the problem. A Livebook is a wonderful place to prototype and a terrible place to leave something. You have to clone it, install Elixir, and run it yourself before it's any use to anyone else. This deserved a front door.
Besides, once I had a meter quietly humming away on the BEAM, I couldn't stop thinking about drawing it. Not graphing it. Drawing it. Something you could actually look at.
Running the parser in reverse
The whole thing rests on one small, satisfying trick: the same library that takes telegrams apart can put them back together. Forward is the day job. Backwards is the new party piece.
elixir
There's one detail that separates a telegram that's real from one that's merely plausible, and it's the checksum. Every telegram signs off with a ! and a CRC16 over everything before it. Get that wrong and a strict parser throws the whole packet straight in the bin, which is exactly the behaviour you want your fixtures to respect. So the simulator builds the struct, renders it once, runs the checksum over that text, and stamps it back in:
elixir
This is dogfooding in the most literal sense I can manage: the simulator's output gets fed straight back through the parser in the test suite. If a round-trip doesn't survive, something's broken in one half or the other. And once or twice, I'll admit, it was the half I'd already declared finished.
Making the numbers move
A meter that reports the same number forever is a deeply boring meter. I wanted the display to behave like an actual household over a day, so a GenServer keeps its own virtual clock and nudges every reading on each tick.
The usage curve is nothing clever, just a cosine wave. Low and sleepy overnight, climbing through the morning, peaking around dinner, with a dusting of random noise so it never looks suspiciously neat:
elixir
On top of that sit the little details that make it feel properly Dutch: a day/night tariff that flips the active register after 23:00, the odd burst of solar being pushed back to the grid on a sunny afternoon, and a gas reading that jumps once an hour rather than creeping up continuously, because that's exactly how the gas meter reports in real life.
None of this is physically rigorous. I'm not modelling anybody's actual fridge. It just has to be convincing enough that whatever you point at it can't tell it's talking to a fake.
One meter, two faces
This is the part where the BEAM quietly shows off.
There's one meter, generating one stream of telegrams, but two completely different crowds want it: people running nc in a terminal, and people watching a LiveView in a browser. Rather than wire the generator up to either of them, it just broadcasts over Phoenix.PubSub and gets on with its life:
elixir
Everything else subscribes. The TCP server subscribes and fans each telegram out to its sockets. Every open web page subscribes and re-renders. The generator has no idea any of them exist. If I want a third audience tomorrow, I add a subscriber and nothing upstream has to change.
The TCP side runs on the same instinct. Each new connection gets handed its own little GenServer, monitored so a dropped socket tidies up after itself. In most runtimes a process per client would raise an eyebrow. Here it's just how you'd write it.
Pretending to be slow hardware
Here's a detail nobody asked for, which is precisely why it's my favourite.
A real P1 port doesn't hand you a telegram all in one go. It's a serial line, dribbling bytes out at 115200 baud, and firing the whole packet down the socket in a single send felt like cheating. So each line sleeps for roughly as long as the wire would have taken to carry it:
elixir
It's a tiny, faintly ridiculous touch. But it means a client reading the stream watches the telegram arrive line by line, exactly the way it would off real hardware. That is the kind of thing that flushes out a bug in how you buffer input.
The star: a fake meter in pure LiveView
The TCP stream is the genuinely useful bit. But the part I had no business enjoying as much as I did is the one you can see.
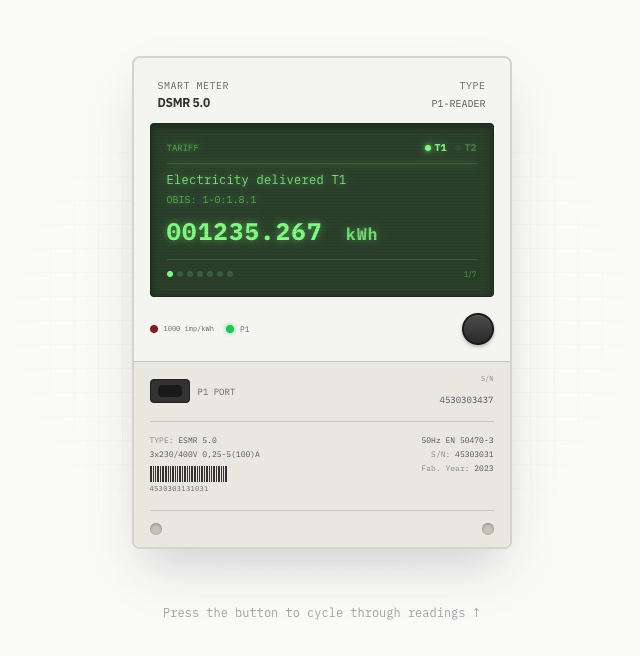
It's a smart meter. A skeuomorphic one: CRT-green display, faint scanlines, little tariff lights, an LED blinking away at "1000 imp/kWh", an SVG barcode on the type plate, even a chunky physical-looking button. All of it rendered server-side in LiveView, updating every second, without a single line of custom JavaScript.
It's built entirely from HEEx function components, and it's fed by the very same PubSub message the nc crowd gets. When one lands, the LiveView turns the struct into display rows and re-renders:
elixir
LiveView works out what actually changed and pushes only that down the socket. The numbers climb, the tariff light switches over at night, the little connection dot goes green. The only client-side code anywhere near it is the LiveView runtime everyone already ships.
My favourite piece is the button. A real meter has one button to cycle through its readings, so naturally mine does too. It is just a phx-click bumping an index in the server-side state:
html
There is no client state or fetch layer to keep in sync. You press a styled <button>, the server moves to the next reading and sends back the difference. Building hardware-shaped UI in something this plain turned out to be an absurd amount of fun. The skeuomorphism is all CSS and SVG, and the behaviour is all server.
Try it
It's live, and the quickest way in is your terminal:
A fresh DSMR 5.0 telegram every second, the same bytes a real P1 reader would hand you, checksum and all. Or open p1meter.dev and watch the meter tick, with copy-paste client examples for Node, Python and Go sitting right underneath.
It's intentionally small, and it's all open source over on GitHub. I've been collecting ideas for where to take it next: realistic daily patterns, configurable scenarios, the kind of nasty edge cases that exist purely to break parsers.
What's stuck with me, building this, is how little of it is really code I wrote. The parser was already there; I just ran it backwards. PubSub did the fan-out, OTP supervised the clients, LiveView did the live UI. My actual job came down to deciding what a believable meter should do, then getting out of the runtime's way.
So if you're working on anything P1- or DSMR-shaped, point it at the simulator and tell me what breaks. That's half the reason it's out there.